Demographics visualizations
Child age
Child age in months (age_group) by child_sex.
Note: The child’s exact age in months is part of the Databrary-related data. That is on the work plan.
xtabs(formula = ~ age_group + child_sex,
      data = home_visit_filtered)
## child_sex
## age_group female male
## 12mo 116 95
## 18mo 102 113
## 24mo 86 86A total of \(n=\) 598 mother-infant dyads have been tested. This includes training and pilot visits.
home_visit_filtered |>
  ggplot() +
  aes(age_group, fill = child_sex) +
  geom_bar() +
  theme(legend.position = "bottom") +
  theme(legend.title = element_blank())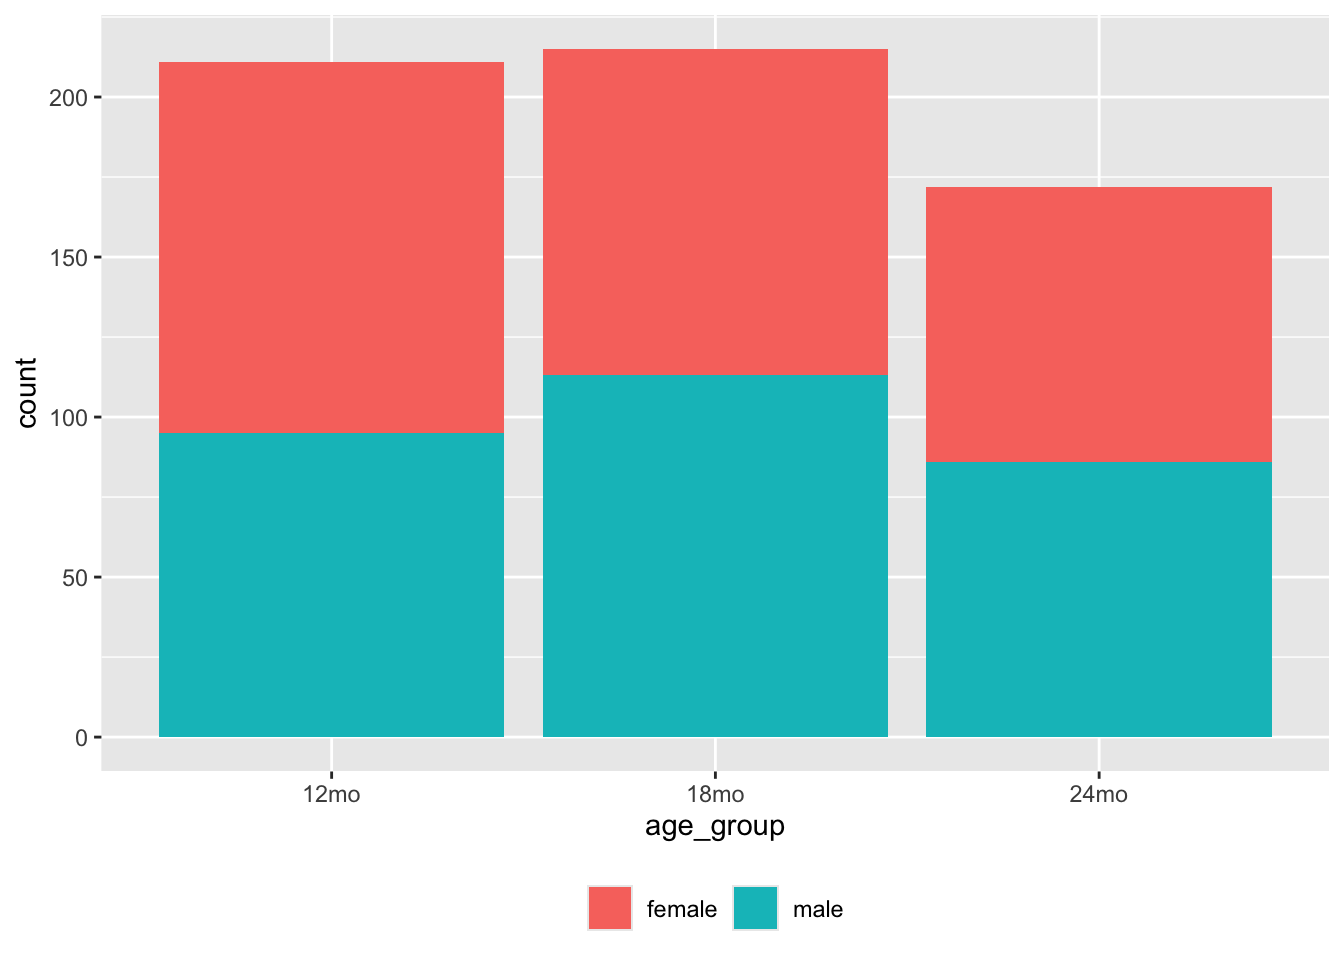
Figure 4: Participants by age group and sex
Time series
To calculate cumulative visits, we have to add an index variable
df <- home_visit_filtered |>
  dplyr::select(test_date, site_id) |>
  dplyr::mutate(test_date = as.Date(test_date)) |>
  dplyr::arrange(test_date) |>
  dplyr::mutate(n_visits = seq_along(test_date))
df |>
  dplyr::filter(!is.na(test_date),
                !is.na(n_visits),
                !is.na(site_id)) |>
  ggplot() +
  aes(test_date, n_visits) +
  geom_point()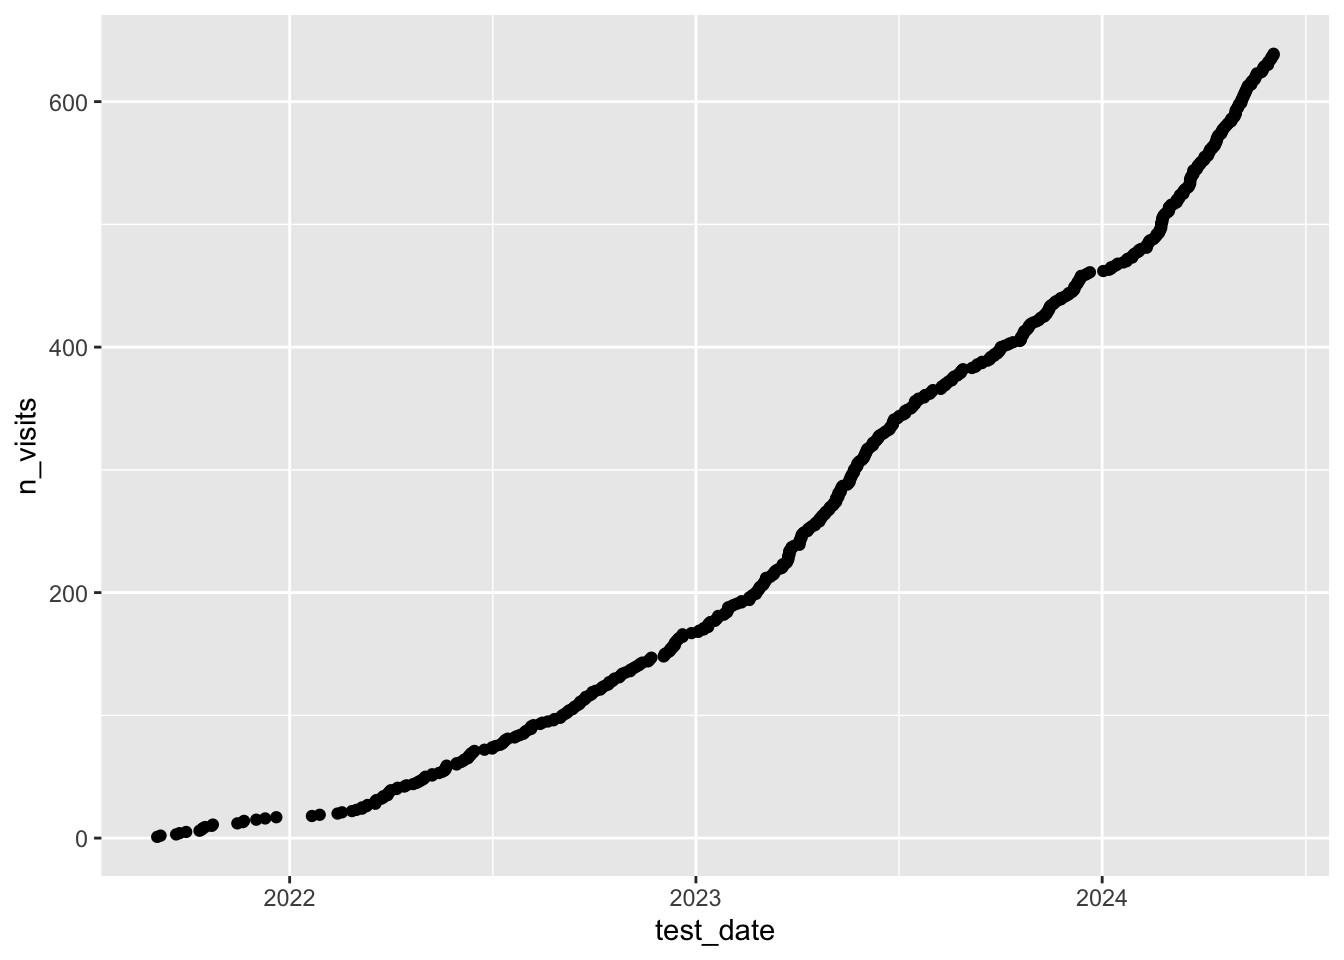
Figure 5: Cumulative home visits by year